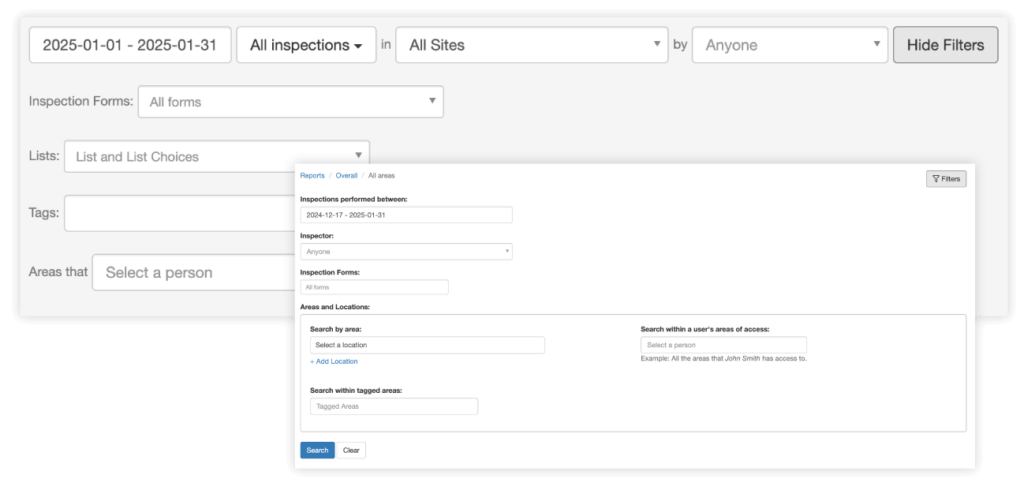
Easy-to-use filters and search tools help you pinpoint and address quality control issues quickly.
Simplify operations with clear, standardized performance tracking
OrangeQC quality control reporting software makes performance trends obvious. Save time with automatically generated reports that focus on your team’s unique performance indicators. Share your findings using professional reports ready for export or email. Get the data you need to make the right decisions for your team.
Quality control reports generated for partners such as:
See results in real-time with automated inspection dashboards
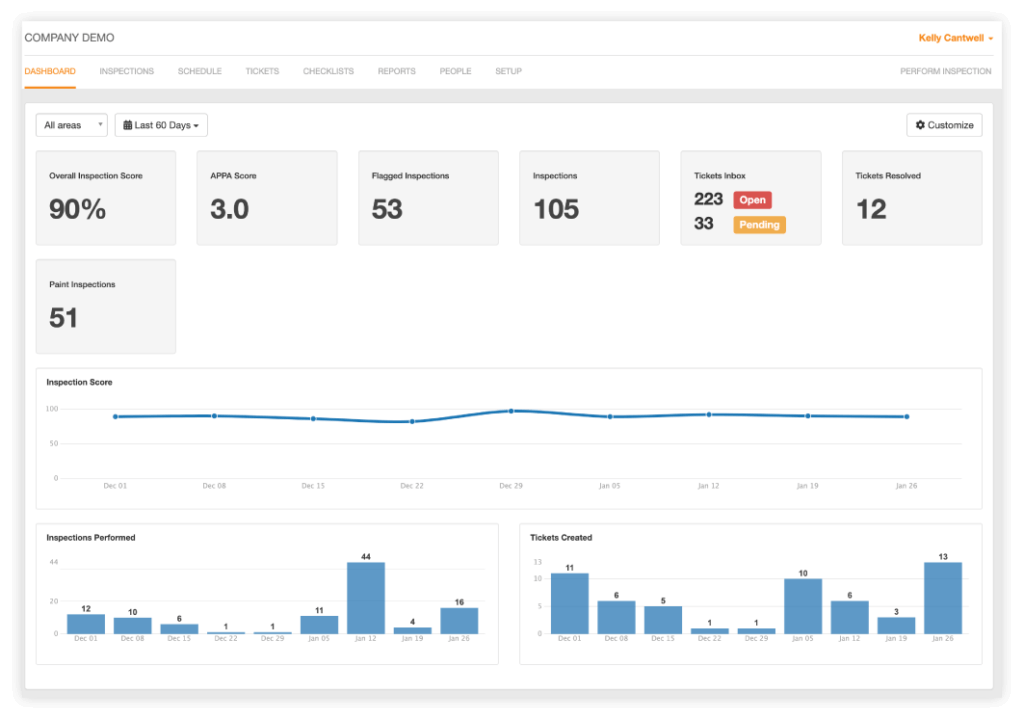
As soon as inspections and tickets are submitted, your quality control dashboard updates. Get the latest inspection data using standardized metrics.
No more waiting for paper forms to make their way back to the office. Our digital inspection software calculates metrics in real-time, keeping the pulse on your team’s performance. In addition:
The dashboard shows average inspection scores, number of inspections performed, tickets generated, average ticket resolution time, and more.
View overall quality control trends for your organization or drill down to specific locations or teams.
Compare areas side-by-side to find low-scoring spaces or sites where inspections are routinely deficient.
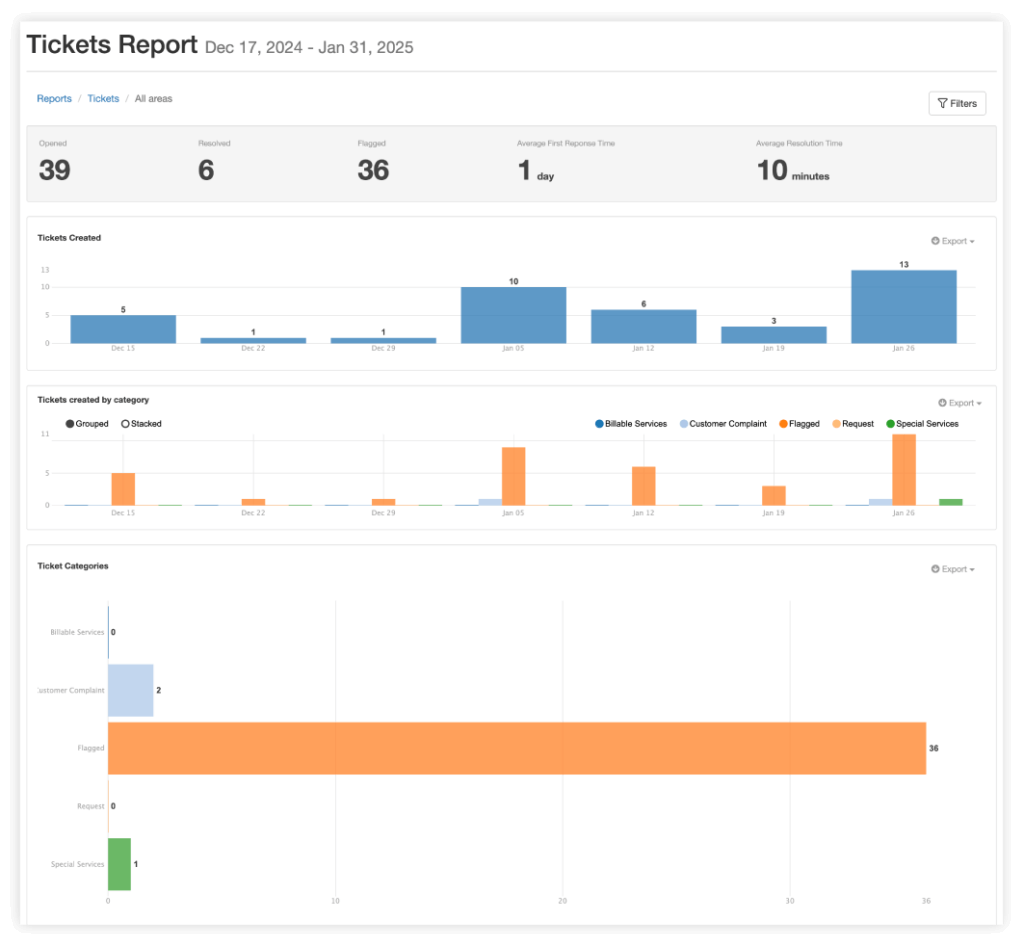
Dig deeper with quality control analytics and tickets reporting
Find out what’s driving quality trends at your sites with a detailed inspection reporting app.
Smart reporting uncovers specific issues before they become a problem for your client or organization. With it, you can:
Know your team’s current quality levels with accuracy, rather than a general idea.
See how many inspection tickets were opened and resolved by your team. Average response and resolution times are automatically calculated.
Track metrics like number of inspections by each individual, average scores given by inspectors, and more, to ensure your supervisors are on the same page.
Import QC data into business intelligence tools, such as Power BI, to create completely custom enterprise dashboards and reports.
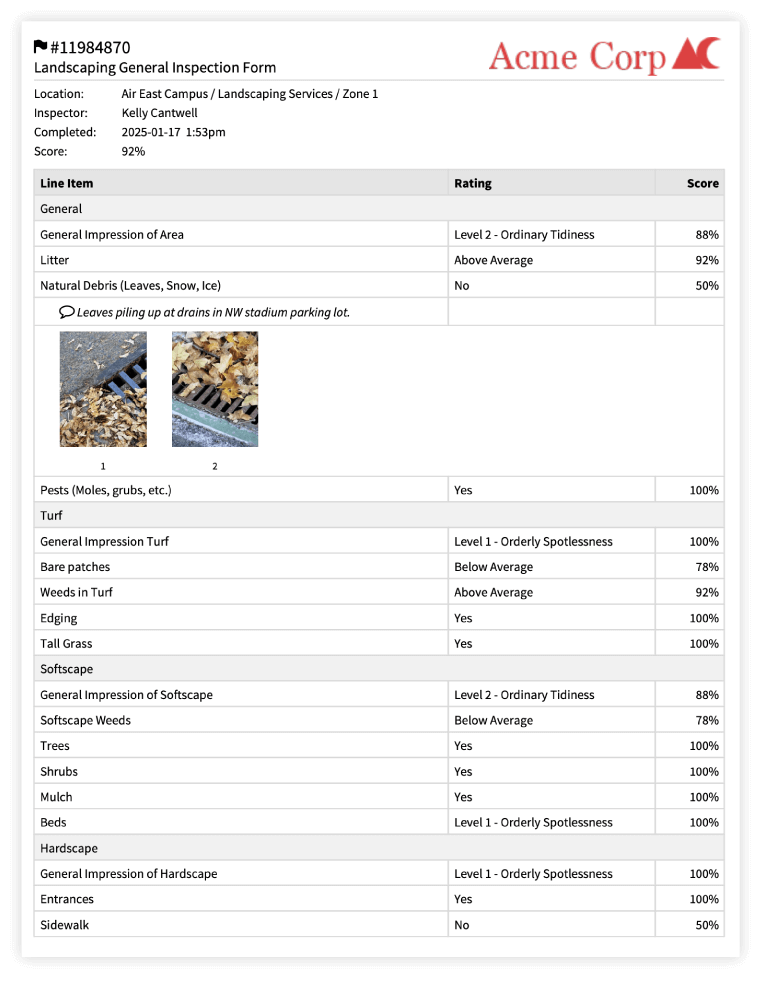
Generate, send, or print professional reports in formats that work for you
Showcase your professional, on-the-ball quality control program to current and prospective clients alike.
When you sit down with potential clients and can talk about average response times and quality control analytics off the cuff, they’ll be impressed. So will your existing clients when you send them professionally designed reports detailing how quality control is working at their buildings.
We generate everything for you, so you can easily:
Get deep insights with powerful filtering options and categorization
Go beyond the big picture to catch small details. Filters and categories help narrow down information by location, users, line item, room type, team, and more. You’re empowered to:
Customize reports to reflect your team’s unique priorities and KPIs.
Reveal trends that affect your performance, using tags.
Sort to find high- and low-performing locations and line items.
Zoom in to the level of detail you need.
Use cases
How clear, big-picture reports help showcase quality at Franciscan University of Steubenville
“When I have my weekly meeting with my boss, I’ve gone from saying ‘We’re doing pretty good,’ to ‘Here’s where we are. Here’s the graph, here’s the reports, here’s where we are.’ There’s a big difference between ‘pretty good’ and ‘94%.’”
Jeff Gilkey Manager of Custodial & Safety Services, Franciscan University of Steubenville